Following post shows an overview of Decision Trees using the Wisconsin Breast Cancer Dataset, from UCI Machine Learning Repository. Decision trees segment the predictor space into regions using splitting rules that can be visualized using a tree. In classification decision trees, each observation belongs to most commonly occurring class.
Wisconsin Breast Cancer Data, collected from the University of Wisconsin Hospitals, Madison from Dr. William H. Wolberg, is composed of 11 cytological attributes computed from digitized images of a fine needle aspirate (FNA) of a breast mass. Collected cell attributes include clump thickness, uniformity of cell size and cell shape, marginal adhesion, single epithelial cell size, bare nuclei, bland chromatin, normal nucleoli and mitoses. Features are used to differentiate between benign and malignant samples, as defined by the Class predictor. For further details about feature definition and data collection, see publication.
Import packages
library(plyr)
library(stats)
library(rpart)
library(rpart.plot)
library(partykit)
Reading and Cleaning Wisconsin Breast Cancer Dataset from UCI Machine Learning Repository
breast_cancer <- read.csv("https://raw.githubusercontent.com/azkajavaid/BreastCancerWisconsinData-UCI/master/BreastCancerData.txt?token=ANkFlyu6ncAg-xoOxqhgB6wSw0GRnuBOks5atcg2wA%3D%3D")
colnames(breast_cancer) <- c("Code", "ClumpThickness", "UniformCellSize", "UniformCellShape", "MarginalAdhesion", "EpithelialCellSize", "BareNuclei", "BlandChromatin", "NormalNucleoli", "Mitoses", "Class")
breast_cancer$Class <- as.character(breast_cancer$Class)
breast_cancer$Class <- revalue(breast_cancer$Class, c("2" = "Benign", "4" = "Malignant"))
breast_cancer$Class <- as.factor(breast_cancer$Class)
breast_cancer <- breast_cancer[!(breast_cancer$BareNuclei == "?"),] # dropping all observations with BareNuclei value of "?"
breast_cancer$BareNuclei <- as.integer(breast_cancer$BareNuclei)
Split data in training and test sets
set.seed(90)
n <- nrow(breast_cancer)
index = sample(1:n, size = round(0.75*n), replace = FALSE)
train = breast_cancer[index, ]
test = breast_cancer[-index, ]
paste("Observations in training data: ", nrow(train), sep = "")
## [1] "Observations in training data: 512"
paste("Observations in testing data: ", nrow(test), sep = "")
## [1] "Observations in testing data: 170"
Fit decision tree predicting Outcome from Diabetes dataset
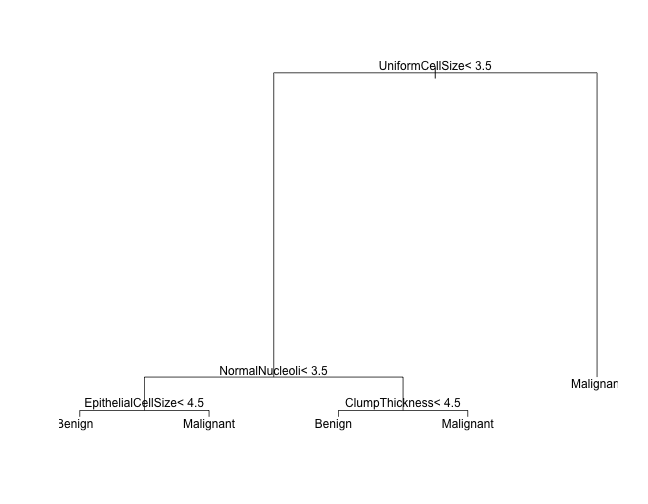
Plot using plot
tree_mod <- rpart(Class ~., data = train)
plot(tree_mod)
text(tree_mod)
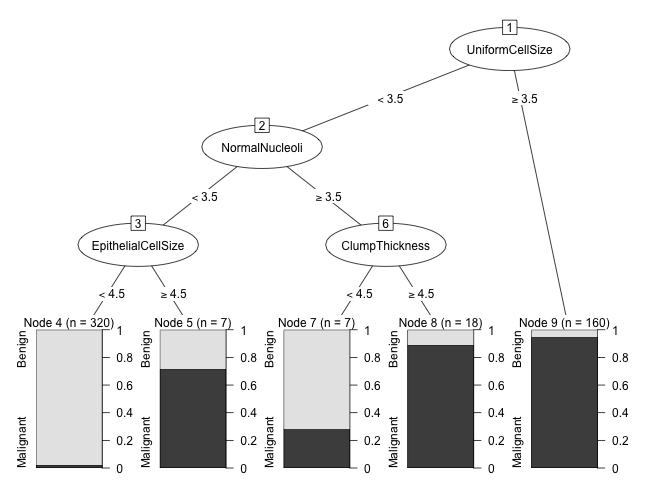
Plot using partykit
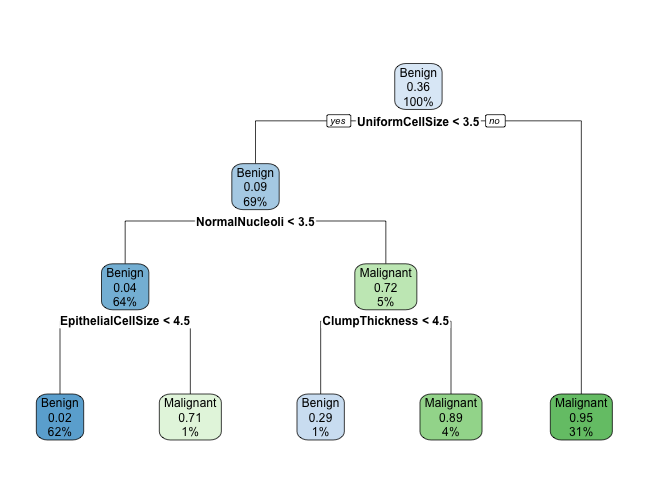
Plot using rpart.plot
Predict model on test data and calculate accuracy
test$predictions <- predict(tree_mod, test, type = "class")
tab <- base::table(test$predictions, test$Class)
sum(diag(tab))/sum(tab) # calculating accuracy