Location Explorer Application uses Google Places, Eventbrite, Meetup and Yelp APIs to provide a coherent and systemic map of events, transportation, food and business vendors for specified geographic location. Application is hosted via shinyapps.io, RStudio's hosting service for Shiny apps, accessible at Shiny Application. This application uses the httr package to obtain authentication credentials and the jsonlite package to retrieve content from APIs in JSON format, which is then converted to R objects. In addition, leaflet is used for final plotting. See code chunk below for additional packages.
library(jsonlite)
library(anytime)
library(httr)
library(shiny)
library(leaflet)
library(lubridate)
library(stringr)
library(ggmap)
This post provides an overview of APIs and Shiny workflow in R. For full code, see GitHub.
Designing User Interface (UI)
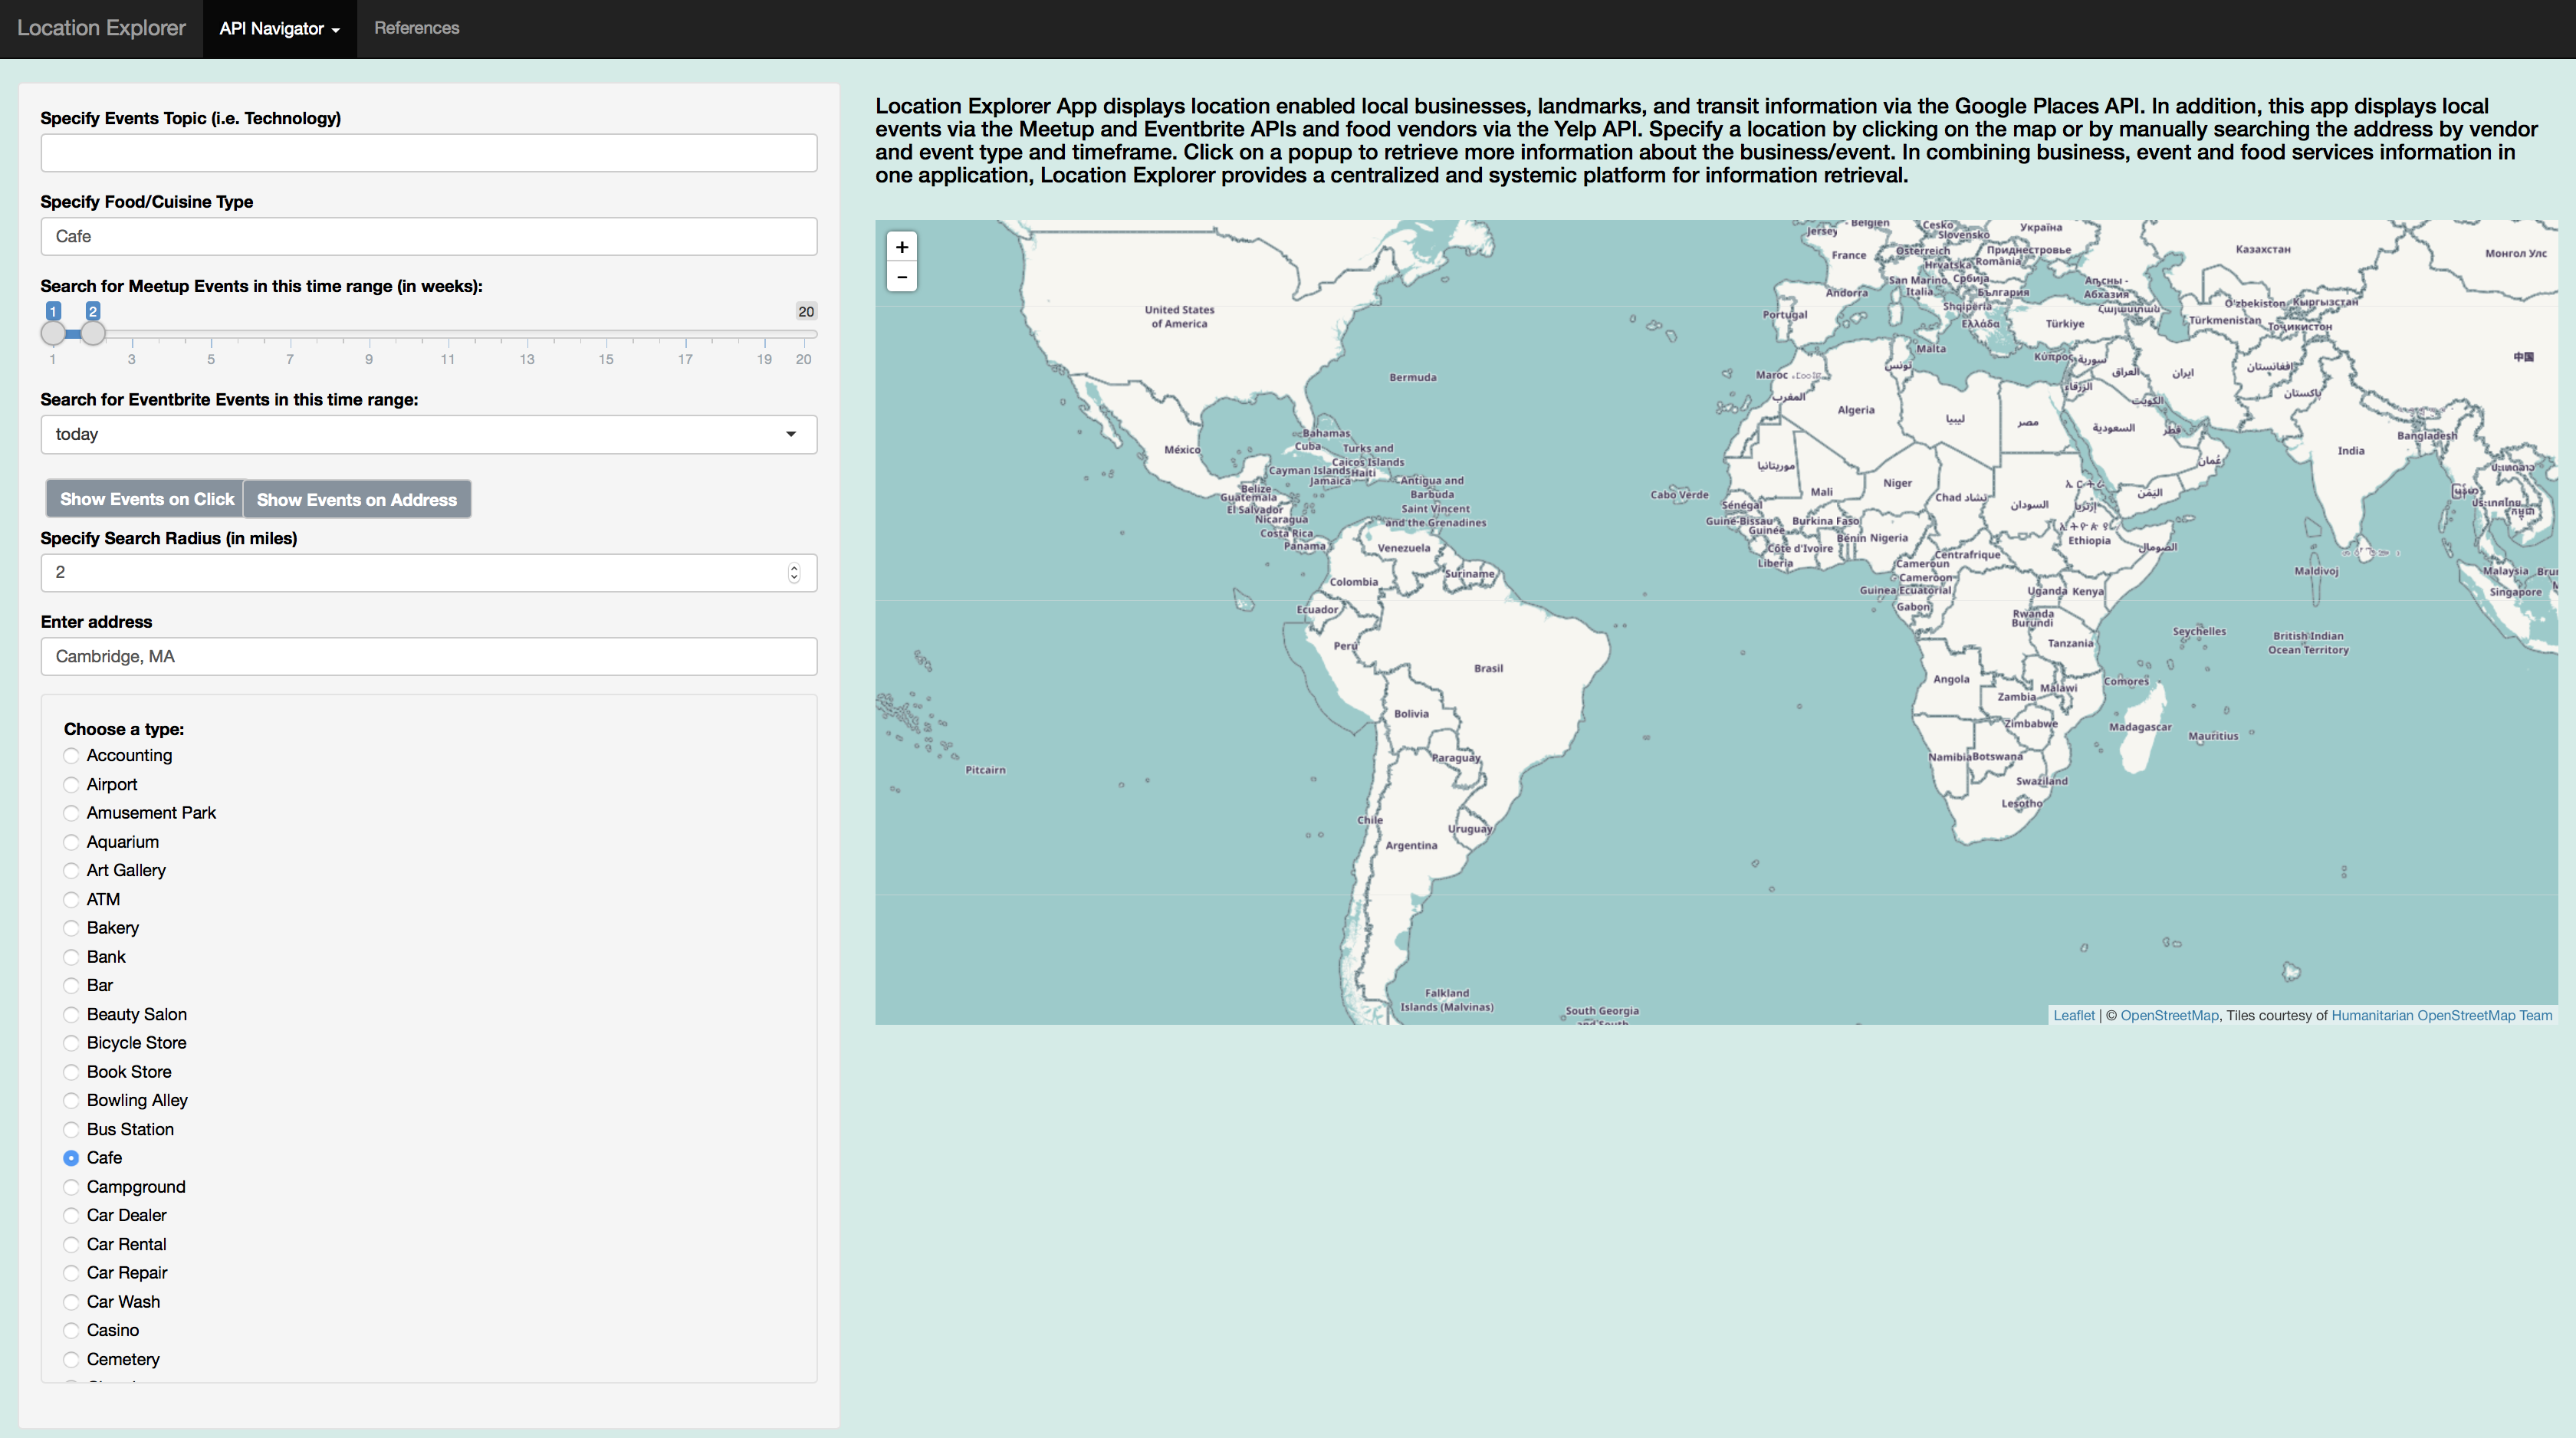
User interface was defined with the navbarPage function from the shiny package. This features creates a page with a navigation bar that holds nested tabPanels. The application background color, #f45c5c, is defined within an HTML tag. Sidebar layout is used to define user interaction features like Eventbrite/Meetup event types and time range. User defined event topic is captured using textInput, event search radius is captured using numericInput, event time range is defined using sliderInput and Google Places are defined using radioButtons. List of radio buttons is wrapped within a scroll bar using, style = "overflow-y:scroll; max-height: 600px". Action buttons, actionButton, are formatted with HTML tags (i.e. button labels are bolded using #eventAddress{font-weight:bold;}). The main map is defined using leafletOutput within mainPanel.
ui <- navbarPage(
  "Location Explorer", inverse = TRUE,
  navbarMenu(
    "API Navigator",
    tabPanel(
      "Google-Meetup-Eventbrite-Yelp",
      # set app background color
      tags$head(
        tags$style(HTML("
                                                       body {
                                                       background-color: #f45c5c;
                                                       color: #000000;
                                                       }
                                                       "))
      ),

      sidebarLayout(
        sidebarPanel(
          textInput("meetupTopic", label = "Specify Events Topic (i.e. Technology)", value = ""),

          textInput("yelpSearch", label = "Specify Food/Cuisine Type", value = "Cafe"),

          # numericInput("weeks", "Specify events time range in weeks", 2),

          sliderInput("meetupTime", "Search for Meetup Events in this time range (in weeks): ", min = 1, max = 20, value = c(1, 2)),

          selectInput("eventBriteTime", "Search for Eventbrite Events in this time range: ", c(
            "today" = "today", "tomorrow" = "tomorrow",
            "this_week" = "this_week", "this_weekend" = "this_weekend",
            "next_week" = "next_week", "this_month" = "this_month",
            "next_month" = "next_month"
          )),


          div(
            style = "display: inline-block;vertical-align:right; width: 165px;",
            actionButton("eventClick", "Show Events on Click", style = "color: #ffffff;background-color: #f45c5c;margin: 4px;")
          ),

          tags$head(
            tags$style(HTML("#eventClick{font-weight:bold;}"))
          ),

          div(
            style = "display: inline-block;vertical-align:right; width: 25px;",

            actionButton("eventAddress", "Show Events on Address", style = "color: #ffffff;background-color: #f45c5c;margin: 6px;")
          ),

          tags$head(
            tags$style(HTML("#eventAddress{font-weight:bold;}"))
          ),

          numericInput("miles", "Specify Search Radius (in miles)", 2, min = 1, max = 31),
          textInput("address", label = "Enter address", value = "Cambridge, MA"),
          wellPanel(
            radioButtons(
              "variable", "Choose a type:",
              c(
                "Accounting" = "accounting",
                "Airport" = "airport", "Amusement Park" = "amusement_park",
                "Aquarium" = "aquarium", "Art Gallery" = "art_gallery",
                "ATM" = "atm", "Bakery" = "bakery", "Bank" = "bank",
                "Bar" = "bar", "Beauty Salon" = "beauty_salon",
                "Bicycle Store" = "bicycle_store", "Book Store" = "book_store",
                "Bowling Alley" = "bowling_alley", "Bus Station" = "bus_station",
                "Cafe" = "cafe", "Campground" = "campground",
                "Car Dealer" = "car_dealer", "Car Rental" = "car_rental",
                "Car Repair" = "car_repair", "Car Wash" = "car_wash",
                "Casino" = "casino", "Cemetery" = "cemetery", "Church" = "church",
                "City Hall" = "city_hall", "Clothing Store" = "clothing_store",
                "Convenience Store" = "convenience_store", "Courthouse" = "courthouse",
                "Dentist" = "dentist", "Department Store" = "department_store",
                "Doctor" = "doctor", "Electrician" = "electrician",
                "Electronics Store" = "electronics_store", "Embassy" = "embassy",
                "Fire Station" = "fire_station", "Florist" = "florist",
                "Funeral Home" = "funeral_home",
                "Furniture Store" = "furniture_store", "Gas Station" = "gas_station",
                "Gym" = "gym", "Hair Care" = "hair_care", "Hardware Store" = "hardware_store",
                "Hindu Temple" = "hindu_temple",
                "Home Goods Store" = "home_goods_store", "Hospital" = "hospital",
                "Insurance Agency" = "insurance_agency", "Jewelry Store" = "jewelry_store",
                "Laundry" = "laundry", "Lawyer" = "lawyer", "Library" = "library",
                "Liquor Store" = "liquor_store", "Local Government Office" = "local_government_office",
                "Locksmith" = "locksmith", "Lodging" = "lodging", "Meal Delivery" = "meal_delivery",
                "Meal Takeaway" = "meal_takeaway", "Mosque" = "mosque", "Movie Rental" = "movie_rental",
                "Movie Theater" = "movie_theater", "Moving Company" = "moving_company", "Museum" = "museum",
                "Night Club" = "night_club", "Painter" = "painter", "Park" = "park",
                "Parking" = "parking", "Pet Store" = "pet_store", "Pharmacy" = "pharmacy",
                "Physiotherapist" = "physiotherapist",
                "Plumber" = "plumber", "Police" = "police", "Post Office" = "post_office",
                "Real Estate Agency" = "real_estate_agency", "Restaurant" = "restaurant",
                "Roofing Contractor" = "roofing_contractor", "RV Park" = "rv_park",
                "School" = "school", "Shoe Store" = "shoe_store", "Shopping Mall" = "shopping_mall",
                "Spa" = "spa", "Stadium" = "stadium", "Storage" = "storage", "Store" = "store",
                "Subway Station" = "subway_station", "Synagogue" = "synagogue",
                "Taxi Stand" = "taxi_stand", "Train Station" = "train_station",
                "Transit Station" = "transit_station", "Travel Agency" = "travel_agency",
                "University" = "university", "Veterinary Care" = "veterinary_care",
                "Zoo" = "zoo"
              ), selected = "cafe"
            ), style = "overflow-y:scroll; max-height: 600px"
          )
        ),
        mainPanel(
          h4("Location Explorer App displays location enabled local businesses, landmarks, and
                                            transit information via the Google Places API. In addition, this app
                                            displays local events
                                            via the Meetup and Eventbrite APIs and food vendors
                                            via the Yelp API. Specify a location by clicking on the map or by manually searching the address by
                                            vendor and event type and timeframe. Click on a popup to
                                            retrieve more information about the business/event. By combining business, event and food services,
                                            Location Explorer Application provides a centralized and systematized platform for
                                            information retrieval.", style = "color:white"),

          tags$head(
            tags$style(HTML("#zoomOut{font-weight:bold;}"))
          ),

          tags$head(
            tags$style(HTML("#zoomIn{font-weight:bold;}"))
          ),

          leafletOutput("map", height = 700)
        )
      )
    )
  )
)
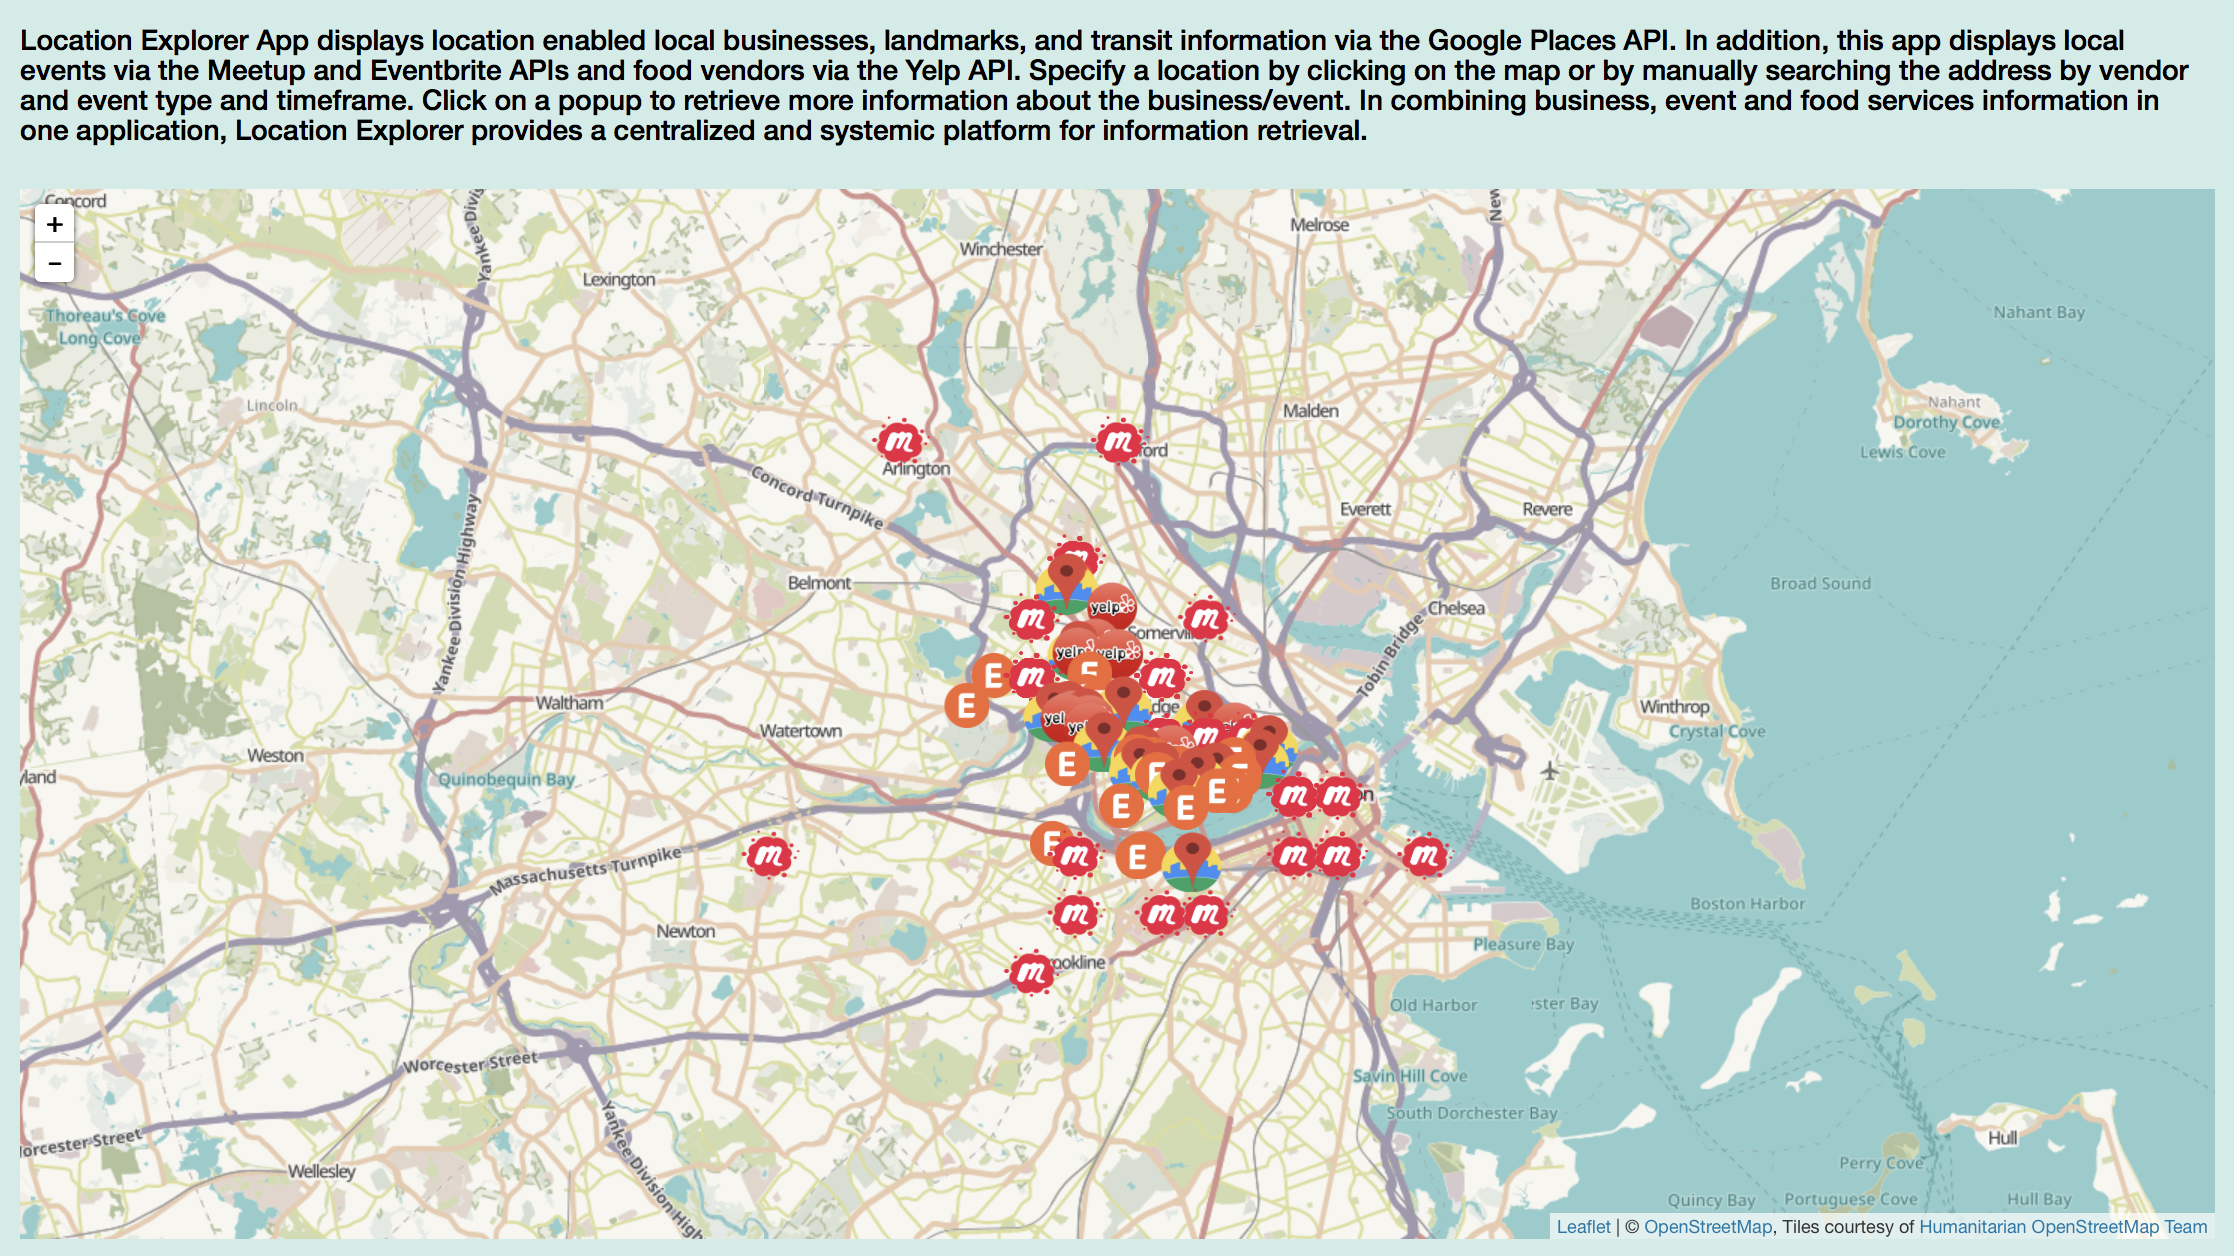
Given an address, search radius, optional Eventbrite/Meetup events topic, events time range and Google Places vendor, the application produces a map of events. Map can also be clicked to retrieve latitude and longitude, which are geocoded and converted to an appropriate location using the ggmap package.
Google Places API
To produce the map of events shown above, user search parameters are concatenated and passed in as arguments to the fromJSON function. As the code chunk below shows, Google Places API is called with the appropriate latitude and longitude coordinates, search radius, location and authentication key credentials.
url <- paste("https://maps.googleapis.com/maps/api/place/nearbysearch/json?location=", clat, ",", clng, "&radius=", distance, "&types=", input$variable, "&key=KEY", sep = "")

document <- fromJSON(txt = url)

dat <- data.frame(
  document$results$geometry$location$lng, document$results$geometry$location$lat,
  document$results$name
)
Retrieved data, document, is further parsed to retrieve vendor rating, price range, proximity information and photos, if present.
if (is.null(document$results$rating) == TRUE) {
rating <- NA
dat <- cbind(dat, rating)
colnames(dat) <- c("lng", "lat", "name", "rating")
}
else {
dat <- cbind(dat, document$results$rating)
colnames(dat) <- c("lng", "lat", "name", "rating")
}
if (is.null(document$results$price_level) == TRUE) {
price_level <- NA
dat <- cbind(dat, price_level)
colnames(dat) <- c("lng", "lat", "name", "rating", "price_level")
}
else {
dat <- cbind(dat, document$results$price_level)
colnames(dat) <- c("lng", "lat", "name", "rating", "price")
dat <- dat %>% dplyr::inner_join(googlePrices)
dat <- dat %>% dplyr::select(lng, lat, name, rating, level)
colnames(dat) <- c("lng", "lat", "name", "rating", "price_level")
}
if (is.null(document$results$vicinity) == TRUE) {
vicinity <- NA
dat <- cbind(dat, vicinity)
colnames(dat) <- c("lng", "lat", "name", "rating", "price_level", "vicinity")
}
else {
dat <- cbind(dat, document$results$vicinity)
colnames(dat) <- c("lng", "lat", "name", "rating", "price_level", "vicinity")
}
photo <- vector("character", length(document$results$name))
if (length(document$results$photos) != 0) {
for (i in 1:length(document$results$photos))
{
if (is.null(document$results$photos[i][[1]]) == FALSE) {
photo[[i]] <- (paste("https://maps.googleapis.com/maps/api/place/photo?maxwidth=300&photoreference=", document$results$photos[i][[1]]$photo_reference[1], "&sensor=false&key=AIzaSyAvfjBJURrg50Axqu5By-20oIc49kfM7mM", sep = ""))
}
else {
photo[[i]] <- "No Available Photo"
}
}
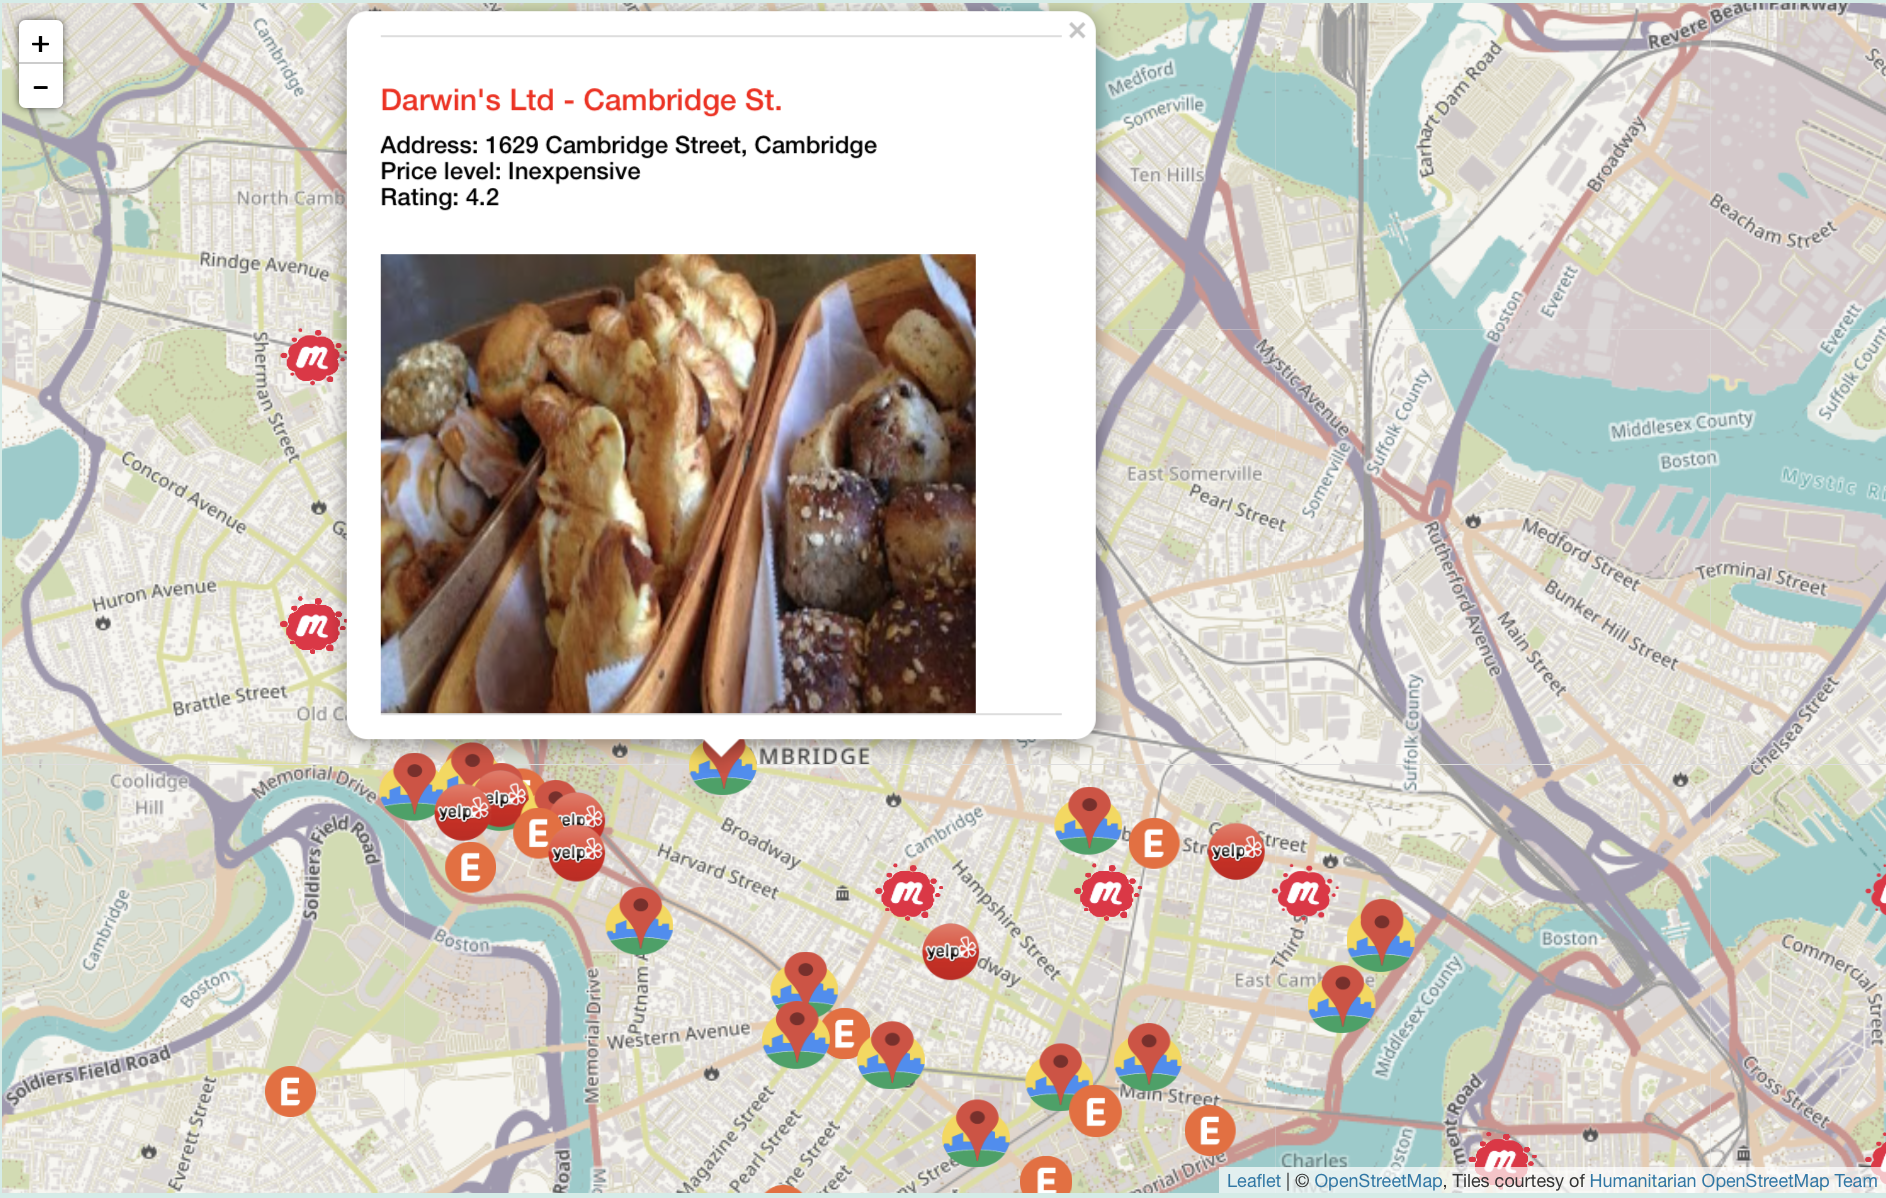
dat <- data.frame(dat, photo)
Image below shows Darwin's cafe as one of the results of searching for Cafes, retrieved using the Google Places API.
Eventbrite API
In addition to the Google Places API, Eventbrite and Meetup APIs are used to retrieve geocoded event information. Eventbrite API is used to obtain event information using latitude, longitude, event search radius, event type and authentication token as shown below.
# if event type (i.e. technology) is defined by the user
eventBUrl <- paste("https://www.eventbriteapi.com/v3/events/search/?location.latitude=", clat, "&location.longitude=", clng, "&location.within=", input$miles, "mi&", "start_date.keyword=", input$eventBriteTime, "&categories=", eventid, "&token=TOKEN&expand=venue", sep = "")
resEventB <- fromJSON(txt = eventBUrl)

# if no event type is defined
eventBUrl <- paste("https://www.eventbriteapi.com/v3/events/search/?location.latitude=", clat, "&location.longitude=", clng, "&location.within=", input$miles, "mi&", "start_date.keyword=", input$eventBriteTime, "&token=TOKEN&expand=venue", sep = "")

resEventB <- fromJSON(txt = eventBUrl)
Location and event time and date information for the Eventbrite events is further parsed using the lubridate package.
startLocal <- strsplit(resEventB$events$start$local, "T")
startLocalDate <- vector("character", length(startLocal))
startLocalTime <- vector("character", length(startLocal))

endLocal <- strsplit(resEventB$events$end$local, "T")
endLocalDate <- vector("character", length(endLocal))
endLocalTime <- vector("character", length(endLocal))
for (i in 1:length(startLocal))
{
  startLocalDate[[i]] <- startLocal[[i]][1]
  startLocalTime[[i]] <- startLocal[[i]][2]
}
for (i in 1:length(endLocal))
{
  endLocalDate[[i]] <- endLocal[[i]][1]
  endLocalTime[[i]] <- endLocal[[i]][2]
}
startLocalDateFinal <- try(format(as.Date(startLocalDate), format = "%B %d %Y"))
startLocalWeekday <- try(weekdays(as.Date(startLocalDate)))

endLocalDateFinal <- try(format(as.Date(endLocalDate), format = "%B %d %Y"))
endLocalWeekday <- try(weekdays(as.Date(endLocalDate)))

startLocalTimeFinal <- try(format(strptime(startLocalTime, format = "%H:%M:%S"), "%I:%M:%S %p"))
endLocalTimeFinal <- try(format(strptime(endLocalTime, format = "%H:%M:%S"), "%I:%M:%S %p"))
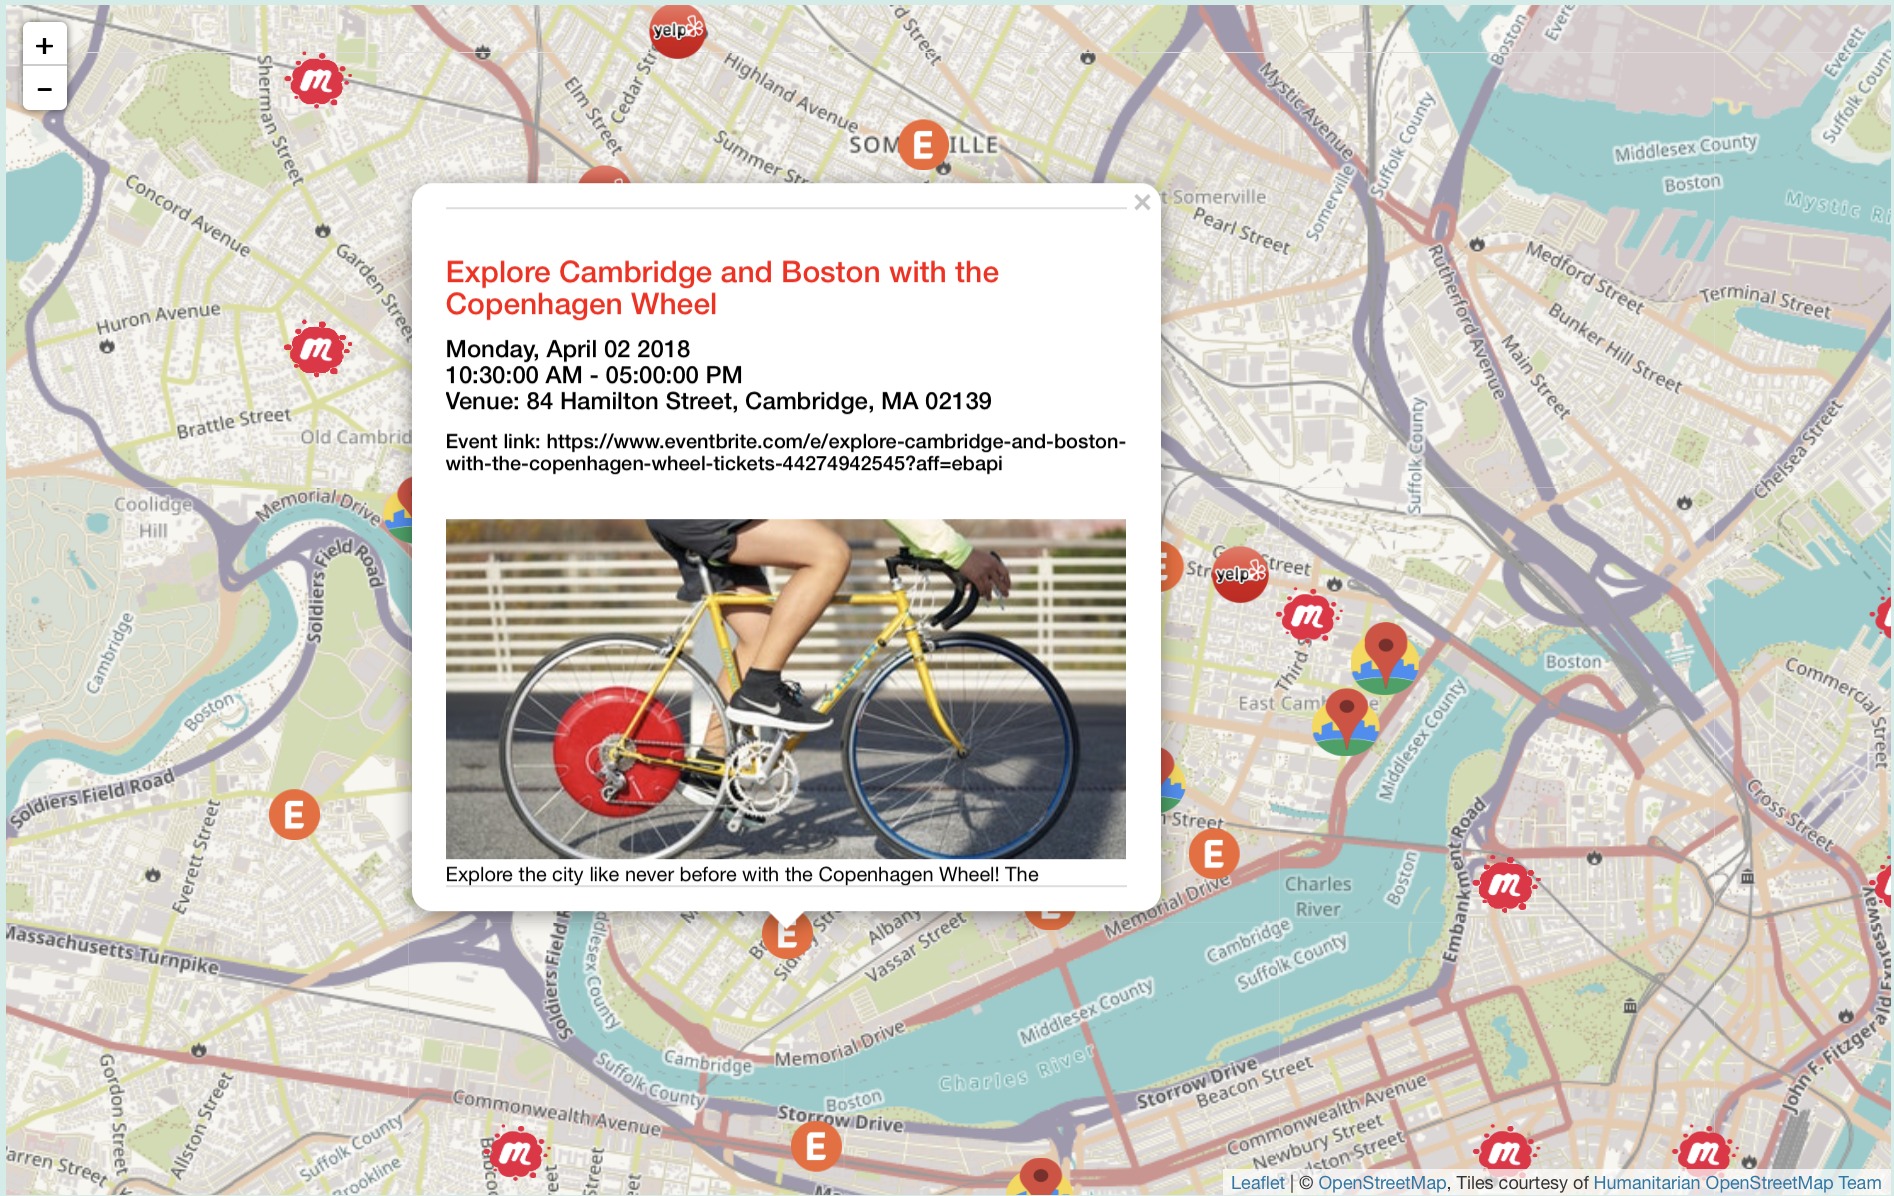
Popup below shows an event in Somerville, MA, retrieved using Eventbrite API.
Meetup API
Meetup events are obtained by concatenating location, search radius, topic, time range and key information as argument to fromJSON.
# if event type (i.e. technology) is defined by the user
json.url <- paste("http://api.meetup.com/2/open_events.json?lat=", clat, "&lon=", clng, "&radius=", input$miles, "&topic=", input$meetupTopic, "&time=", input$meetupTime[1], "w", ",", input$meetupTime[2], "w", "&fields=group_photos;key=KEY", sep = "")

# if no event type is defined
json.url <- paste("http://api.meetup.com/2/open_events.json?lat=", clat, "&lon=", clng, "&radius=", input$miles, "&time=", input$meetupTime[1], "w", ",", input$meetupTime[2], "w", "&fields=group_photos;key=KEY", sep = "")

res <- fromJSON(txt = json.url)
Retrieved text is further processed to parse associated image and event time shown in the querying user's time zone (as indicated by the user's searched latitude and longitude paramters).
photos <- vector("character", length(res$results$group$photos))
for (i in 1:length(res$results$distance))
{
# photos
photo <- data.frame(res$results$group$photos[[i]])
if (is.null(photo[1, ]$photo_link)) {
photos[[i]] <- as.character("NA")
}
else {
photos[[i]] <- photo[1, ]$photo_link
}
}
eventsDat <- data.frame(photos)
# Calculating event start time
eventsDat$timeUTC <- anytime(as.numeric(as.character(res$results$time * 0.001)))
currTime <- Sys.time()
currDate <- as.numeric(as.POSIXct(currTime))
# Retrieving user's time zone
url2 <- paste("https://maps.googleapis.com/maps/api/timezone/json?location=", clat, ",", clng, "×tamp=", currDate, "&key=AIzaSyAvfjBJURrg50Axqu5By-20oIc49kfM7mM", sep = "")
document2 <- fromJSON(txt = url2)
eventsDat$timeZone <- format(eventsDat$timeUTC, tz = document2$timeZoneId, usetz = TRUE)
if (is.null(eventsDat$timeZone) == FALSE) {
timeOnlyStart <- format(ymd_hms(eventsDat$timeZone), "%H:%M:%S") # extract just the time
eventsDat$timeStartFinal <- format(strptime(timeOnlyStart, format = "%H:%M:%S"), "%I:%M:%S %p")
eventsDat$startDate <- as.Date(eventsDat$timeZone)
eventsDat$startDateFinal <- format(eventsDat$startDate, format = "%B %d %Y")
eventsDat$startWeekday <- weekdays(eventsDat$startDate)
}
else {
timeOnlyStart <- "NA"
eventsDat$timeStartFinal <- "NA"
eventsDat$startDate <- "NA"
eventsDat$startDateFinal <- "NA"
eventsDat$startWeekday <- "NA"
}
# Calculating event end time
timeEnd <- vector("raw", length(eventsDat$timeUTC))
if (is.null(res$results$duration)) {
eventsDat$timeEnd <- "NA"
eventsDat$timeEndZone <- "NA"
timeOnlyEnd <- "NA"
eventsDat$timeEndFinal <- "NA"
eventsDat$endDate <- "NA"
eventsDat$endDateFinal <- "NA"
eventsDat$endWeekday <- "NA"
}
else {
eventsDat$timeEnd <- as.POSIXlt(eventsDat$timeUTC) + as.numeric(as.character(res$results$duration)) * 0.001
eventsDat$timeEndZone <- format(eventsDat$timeEnd, tz = document2$timeZoneId, usetz = TRUE)
timeOnlyEnd <- format(ymd_hms(eventsDat$timeEndZone), "%H:%M:%S") # extract just the time
eventsDat$timeEndFinal <- format(strptime(timeOnlyEnd, format = "%H:%M:%S"), "%I:%M:%S %p")
eventsDat$endDate <- as.Date(eventsDat$timeEndZone)
eventsDat$endDateFinal <- format(eventsDat$endDate, format = "%B %d %Y")
eventsDat$endWeekday <- weekdays(eventsDat$endDate)
}
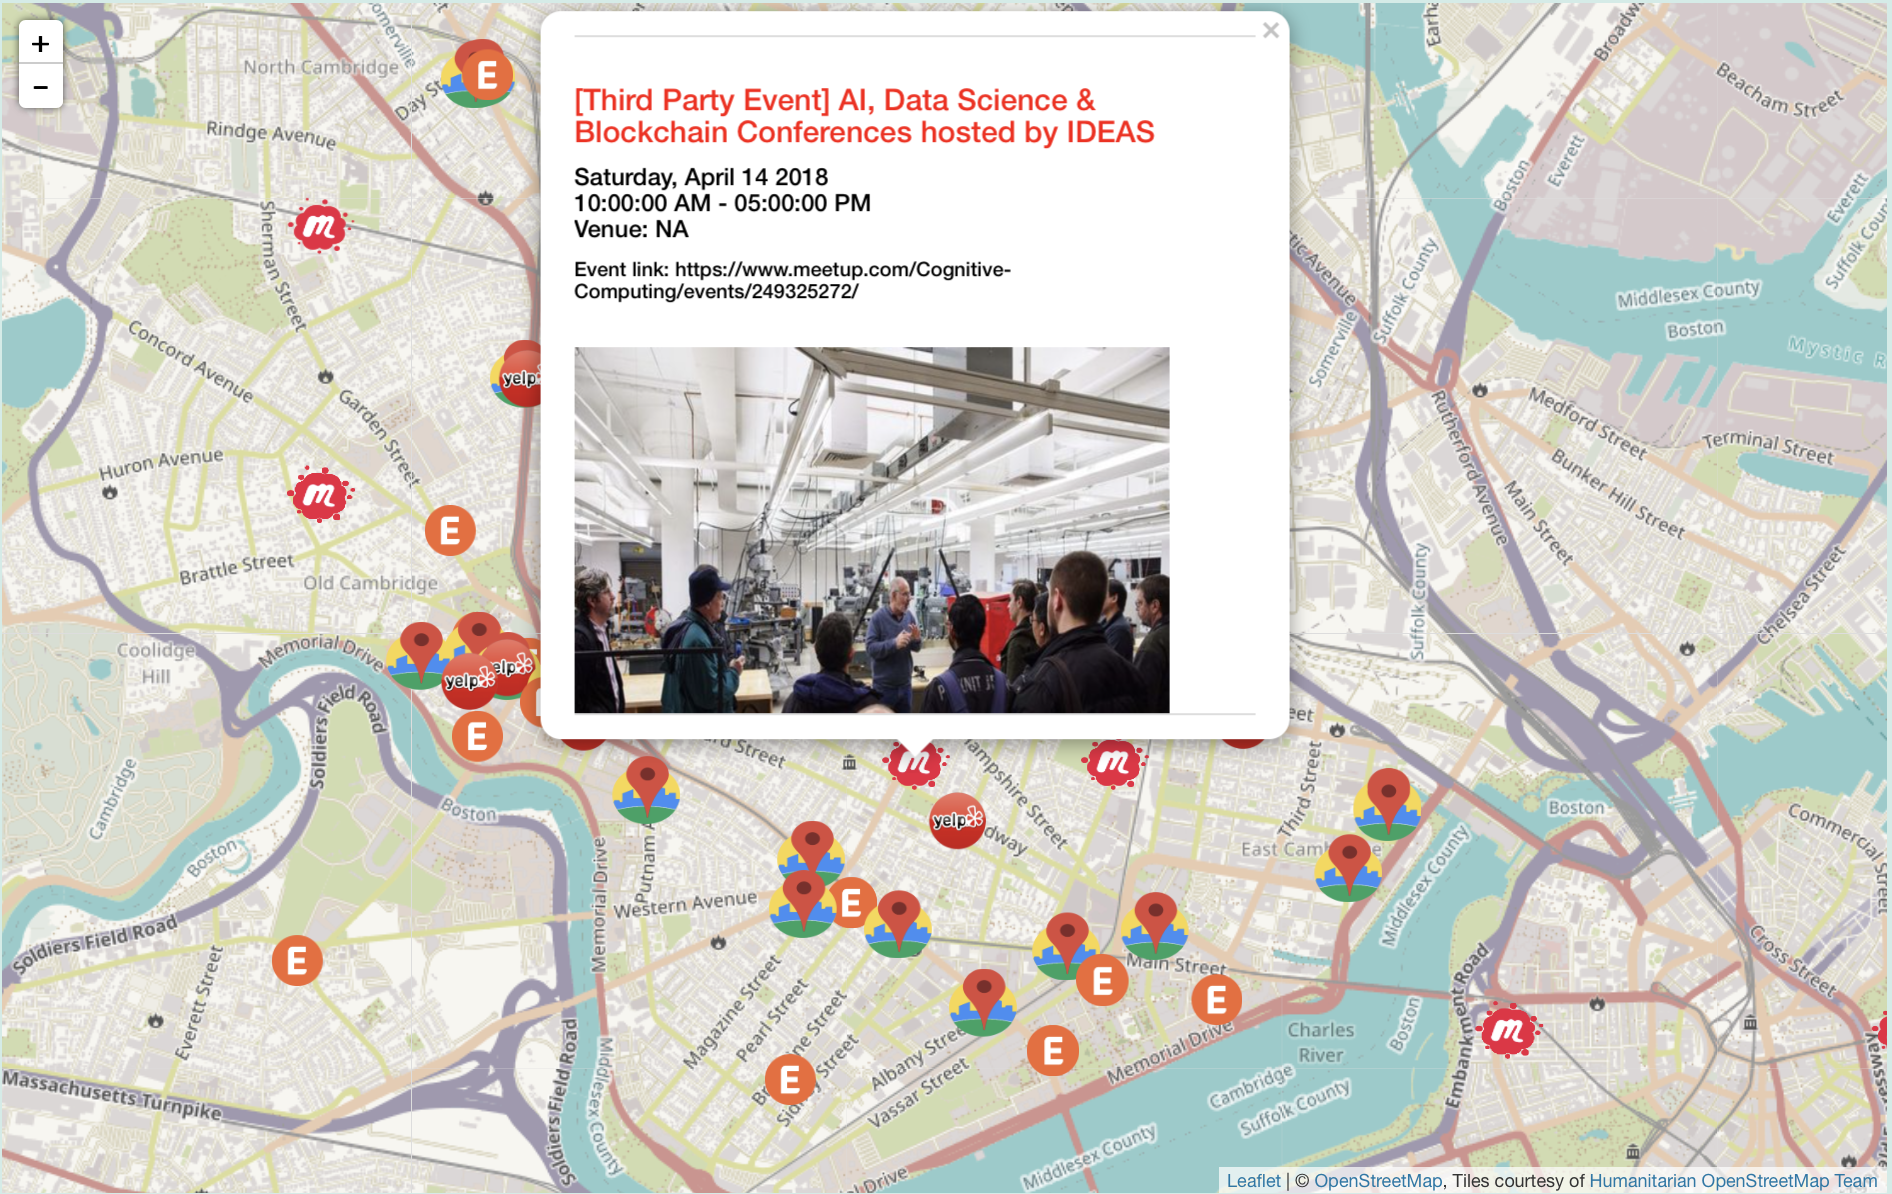
Popup below shows a hiring and networking event in Big Data in Massachusetts.
Yelp API
In addition to the Google, Eventbrite and Meetup APIs, Yelp API was used to retrieve information about geocoded food vendors. Yelp API switched to API authentication from OAuth 2.0 authentication in March, 2018 and therefore only requires API key for authentication. To retrieve content, search parameter, latitude, longitude and search radius are passed as inputs to modify_url from the httr package. The modified url and the API key are then passed as parameters to GET from httr. The contents of the request are retrieved using content from httr.
url2 <- modify_url(
  "https://api.yelp.com", path = c("v3", "businesses", "search"),
  query = list(
    term = input$yelpSearch, latitude = clat, longitude = clng, radius_filter = radiusYelp,
    limit = 10
  )
)
res <- GET(url2, add_headers("Authorization" = paste("bearer", API_KEY)))
ct <- content(res)
Further text processing is used to retrieve business name, location, closing status, price, rating and image if present for the food vendors using the Yelp API.
latitudeYelp <- vector("character", length(ct$businesses))
longitudeYelp <- vector("character", length(ct$businesses))
businessName <- vector("character", length(ct$businesses))
imageURL <- vector("character", length(ct$businesses))
isClosed <- vector("character", length(ct$businesses))
businessRating <- vector("character", length(ct$businesses))
businessPrice <- vector("character", length(ct$businesses))
displayAddress <- vector("character", length(ct$businesses))

for (i in 1:length(ct$businesses))
{
  if (is.null(ct$businesses[[i]]$coordinates$latitude)) {
    latitudeYelp[[i]] <- "NA"
  }
  else {
    latitudeYelp[[i]] <- ct$businesses[[i]]$coordinates$latitude
  }
  if (is.null(ct$businesses[[i]]$coordinates$longitude)) {
    longitudeYelp[[i]] <- "NA"
  }
  else {
    longitudeYelp[[i]] <- ct$businesses[[i]]$coordinates$longitude
  }
  if (is.null(ct$businesses[[i]]$name)) {
    businessName[[i]] <- "NA"
  }
  else {
    businessName[[i]] <- ct$businesses[[i]]$name
  }
  if (is.null(ct$businesses[[i]]$image_url)) {
    imageURL[[i]] <- "NA"
  }
  else {
    imageURL[[i]] <- ct$businesses[[i]]$image_url
  }
  if (is.null(ct$businesses[[i]]$is_closed)) {
    isClosed[[i]] <- "NA"
  }
  else {
    isClosed[[i]] <- ct$businesses[[i]]$is_closed
  }
  if (is.null(ct$businesses[[i]]$rating)) {
    businessRating[[i]] <- "NA"
  }
  else {
    businessRating[[i]] <- ct$businesses[[i]]$rating
  }
  if (is.null(ct$businesses[[i]]$price)) {
    businessPrice[[i]] <- "NA"
  }
  else {
    businessPrice[[i]] <- ct$businesses[[i]]$price
  }
  if (is.null(ct$businesses[[i]]$location$display_address)) {
    displayAddress[[i]] <- "NA"
    # print(i)
  }
  else {
    if (length(ct$businesses[[i]]$location$display_address) == 1) {
      displayAddress[[i]] <- ct$businesses[[i]]$location$display_address[[1]]
    }
    else if (length(ct$businesses[[i]]$location$display_address) == 2) {
      add <- paste(ct$businesses[[i]]$location$display_address[[1]], ct$businesses[[i]]$location$display_address[[2]], sep = ", ")
      displayAddress[[i]] <- add
    }
    else {
      displayAddress[[i]] <- ct$businesses[[i]]$location$display_address[[1]]
    }
  }
}
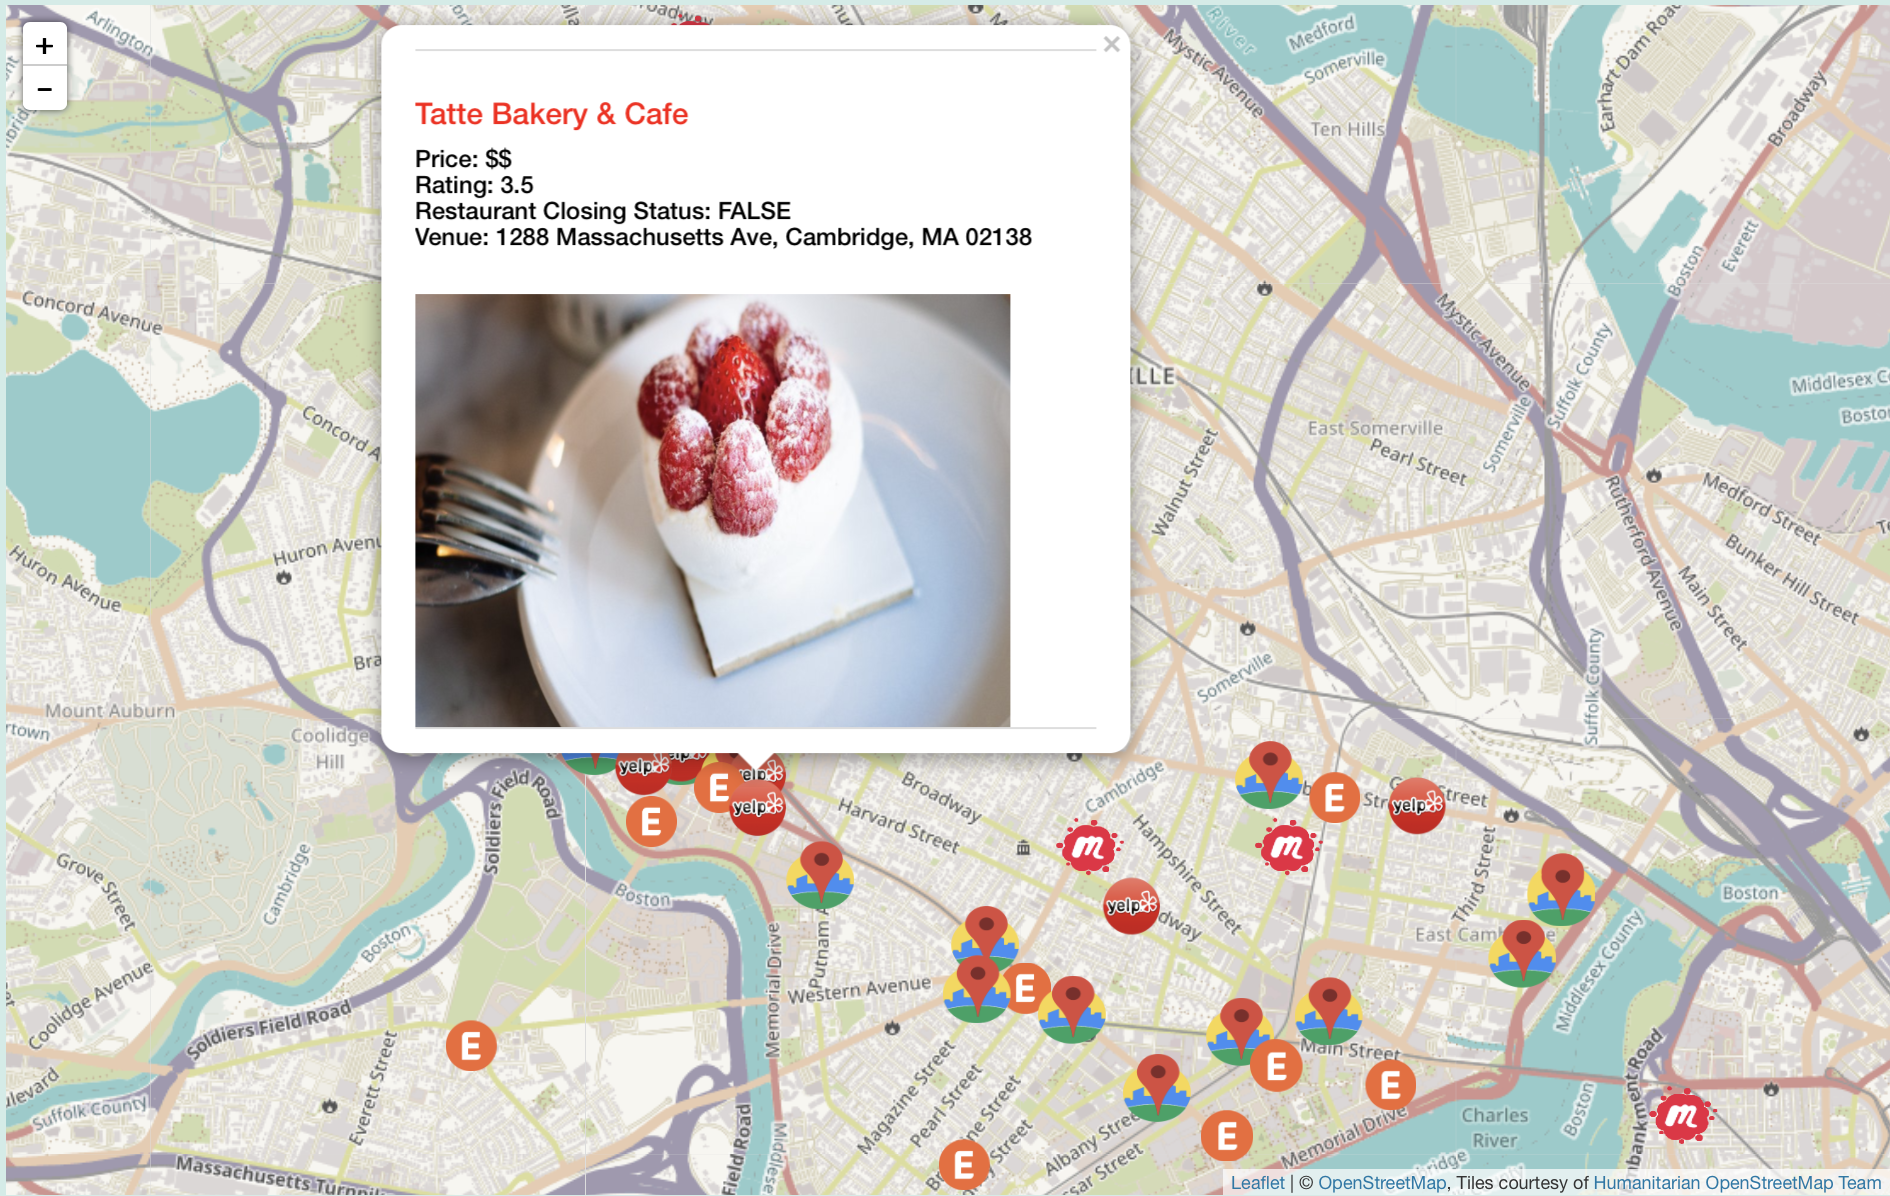
Image below shows example of retrieved Tatte Bakery and Cafe via Yelp API in Cambridge, MA.
Plotting via Leaflet
Popup symbols were specified using the makeIcon function from the leaflet package given an image url, width and height. Code below shows an example specification of an icon. Symbols were defined for each of the four APIs (Eventbrite, Google, Meetup and Yelp).
googleIcon <- makeIcon(
  iconUrl = "IMAGE URL",
  iconWidth = 40, iconHeight = 40,
  iconAnchorX = 0, iconAnchorY = 0
)
Leaflet was used for final plotting. Leaflet, map, was initially defined with default coordinates and OpenStreetMap.France tiles. For additional tiles, see documentation. As shown below, output from each of the four APIs was added as a separate Marker layer. In each layer, location information was encoded in latitude and longitude coordinates. Popup detailed event and vendor name, photo as well as event venue and start and end time. Icon detailed the popup symbol and rendering options like popup width, height and whether or not the popup should be closed on map click.
output$map <- renderLeaflet({
    leaflet() %>%
      setView(lng = -18.455845, lat = -3.26, zoom = 2) %>%
      addProviderTiles(providers$OpenStreetMap.France, options = providerTileOptions(noWrap = TRUE))
  })

leafletProxy("map") %>%
  clearMarkers() %>%
  clearPopups() %>%
  setView(lng = clng, lat = clat, zoom = 10) %>%
  addMarkers(
    lng = as.numeric(as.character(res$results$group$group_lon)),
    lat = as.numeric(as.character(res$results$group$group_lat)),
    popup = paste(
      "<br>", "<h4 style='color:red;'>", res$results$name, "</br>", "</h4>", "<h5>",
      paste(eventsDat$startWeekday, eventsDat$startDateFinal, sep = ", "), "<br>",
      paste(eventsDat$timeStartFinal, eventsDat$timeEndFinal, sep = " - "),
      "<br>", paste("Venue:", res$results$venue$address_1, sep = " "), "</h5>",
      "<h6>", paste("Event link:", res$results$event_url, sep = " "), "</h6>", "</br>",
      paste0("<img src = ", eventsDat$photos, " width = 350", " height = 300", ">"),
      "<br>",
      "<h6>", res$results$group$name, "</h6>", "<br>",
      res$results$description
    ),
    icon = meetupIcon, popupOptions = popupOptions(minWidth = 400, maxWidth = 400, maxHeight = 400, closeOnClick = TRUE)
  ) %>%
  addMarkers(
    lng = as.numeric(as.character(resEventB$events$venue$longitude)),
    lat = as.numeric(as.character(resEventB$events$venue$latitude)),
    popup = paste(
      "<br>", "<h4 style='color:red;'>", resEventB$events$name$text, "</br>", "</h4>", "<h5>",
      paste(startLocalWeekday, startLocalDateFinal, sep = ", "), "<br>",
      paste(startLocalTimeFinal, endLocalTimeFinal, sep = " - "),
      "<br>", paste("Venue:", resEventB$events$venue$address$localized_address_display, sep = " "), "</h5>",
      "<h6>", paste("Event link:", resEventB$events$url, sep = " "), "</h6>", "</br>",
      paste0("<img src = ", resEventB$events$logo$url, ">"),
      "<br>",
      resEventB$events$description$text
    ),
    icon = eventBrightIcon, popupOptions = popupOptions(minWidth = 400, maxWidth = 400, maxHeight = 400, closeOnClick = TRUE)
  ) %>%
  addMarkers(
    lng = dat$lng, lat = dat$lat, group = "circles",
    popup = paste(
      "<br>", "<h4 style='color:red;'>", dat$name, "</br>", "</h4>", "<h5>",
      paste("Address: ", dat$vicinity, sep = ""), "<br>",
      paste("Price level: ", dat$price_level, sep = ""), "<br>",
      paste("Rating: ", dat$rating, sep = ""), "</h5>", "</br>"
    ), icon = googleIcon,
    popupOptions = popupOptions(minWidth = 400, maxWidth = 400, maxHeight = 400, closeOnClick = TRUE)
  ) %>%
  addMarkers(
    lng = as.numeric(longitudeYelp), lat = as.numeric(latitudeYelp),
    popup = paste(
      "<br>", "<h4 style='color:red;'>", businessName, "</br>", "</h4>", "<h5>",
      paste("Price: ", businessPrice, sep = ""), "<br>",
      paste("Rating: ", businessRating, sep = ""), "<br>",
      paste("Restaurant Closing Status: ", isClosed, sep = ""),
      "<br>", paste("Venue: ", displayAddress, sep = " "), "</h5>", "</br>",
      paste0("<img src = ", imageURL, " width = 350", " height = 300", ">"),
      "<br>"
    ),
    icon = yelpIcon, popupOptions = popupOptions(minWidth = 400, maxWidth = 400, maxHeight = 400, closeOnClick = TRUE)
  )
Code Formatting
Leaflet plot was embedded in observe from shiny package, which acts similarly to a reactive expression but whereas a reactive expression returns an output, observer produces a rendered output. Application code was embedded within a progress bar, which was approximately incremented as shown, to display remaining run time.
withProgress(message = "Application loading", value = 0, {
  #code
  incProgress(0.3, detail = "Getting data")
  #code
  incProgress(0.7, detail = "Finishing")
})
Events were geocoded based on both user address and click. User click was captured using map_click. Individual latitude and longitude coordinates were accessed from click output, click, using click$lat and click$lng.
mapClick <- eventReactive(input$eventClick, {
  click <- input$map_click
  return(click)
})

click <- mapClick()
clat <- click$lat
clng <- click$lng
Deploying Shiny Application
The application was deployed using shinyapps.io. After an online account was created, rsconnect package was used. Before deployment, setAccountInfo was used to define user credentials, token and secret key using schema shown below. Lastly, deployApp function was used to define path to the application (ui and server files) and to finally deploy the application.
rsconnect::setAccountInfo(name='USER',
              token='TOKEN',
              secret='<SECRET>')
deployApp('/PathToApplication')