Import packages
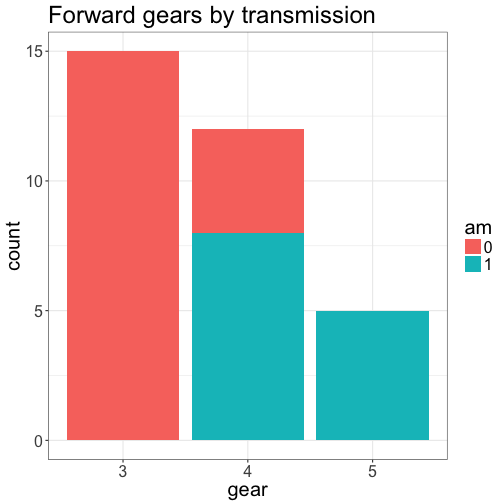
Bar plot count of forward gears, gear, by transmission status, am from mtcars dataset
mtcars$am <- as.character(mtcars$am) # convert from numeric to character
mtcars$gear <- as.character(mtcars$gear) # convert from numeric to character
ggplot(mtcars, aes(x = gear, fill = am)) + geom_bar() + ggtitle("Forward gears by transmission") + theme_bw() + theme(text = element_text(size = 20)) # fill by am
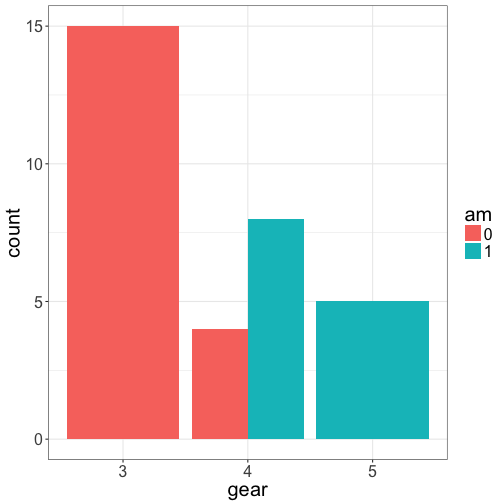
Side formatted bar plot
ggplot(mtcars, aes(x = gear, fill = am)) + geom_bar(position = position_dodge()) + theme_bw() + theme(text = element_text(size = 20)) # fill by am
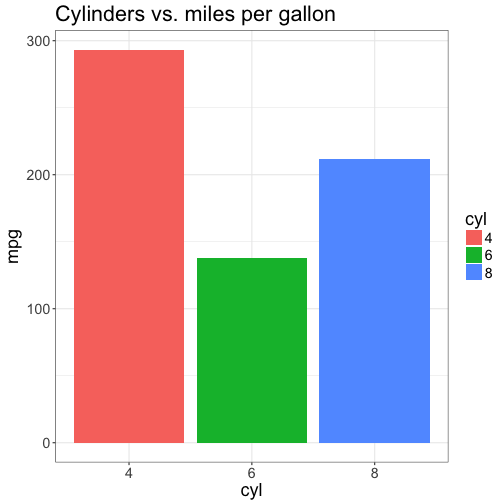
Plot miles per gallon, mpg, by number of cylinders, cyl
mtcars$cyl <- as.character(mtcars$cyl) # convert from numeric to character
ggplot(mtcars, aes(x = cyl, y = mpg, fill = cyl)) + geom_bar(stat = "identity") + ggtitle("Cylinders vs. miles per gallon") + theme_bw () + theme(text = element_text(size = 18)) # specify identity to plot x against y (otherwise count is plotted)
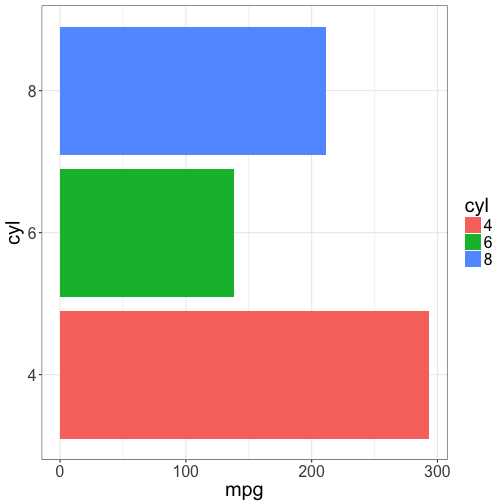
Flipped bar plot
ggplot(mtcars, aes(x = cyl, y = mpg, fill = cyl)) + geom_bar(stat = "identity") +
  theme_bw () + coord_flip() + theme(text = element_text(size = 20)) # specify identity to plot x against y (otherwise count is plotted)