Import packages
library(ggplot2)
Plotting quantitative predictors against Species
head(iris)
##   Sepal.Length Sepal.Width Petal.Length Petal.Width Species
## 1          5.1         3.5          1.4         0.2  setosa
## 2          4.9         3.0          1.4         0.2  setosa
## 3          4.7         3.2          1.3         0.2  setosa
## 4          4.6         3.1          1.5         0.2  setosa
## 5          5.0         3.6          1.4         0.2  setosa
## 6          5.4         3.9          1.7         0.4  setosa
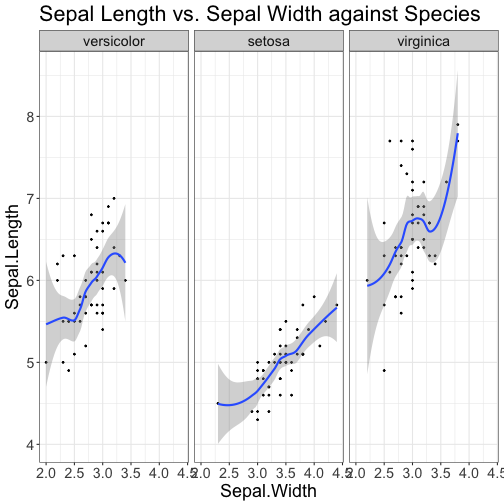
ggplot(iris, aes(x = Sepal.Width, y = Sepal.Length)) +
  facet_wrap(~Species) + geom_point(size = 0.5) + geom_smooth() + theme_bw() +
  ggtitle("Sepal Length vs. Sepal Width against Species")