Import packages
library(ggplot2)
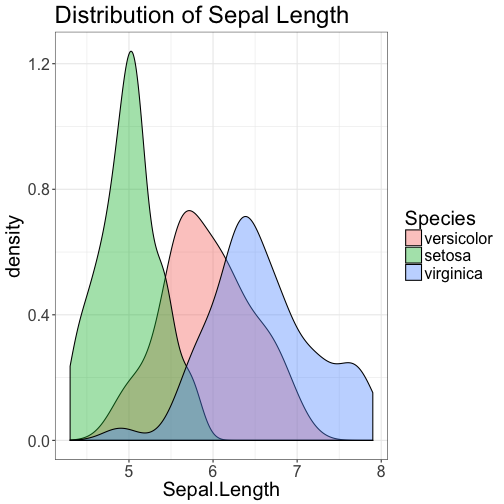
Density plot of sepal length, Sepal.Length, by specie status, Species, from iris dataset
ggplot(iris, aes(x = Sepal.Length, fill = Species)) +
  geom_density(color = "black", alpha = 0.4) + # specify alpha indicating density plot shading frequency
  ggtitle("Distribution of Sepal Length") + theme_bw() + theme(text = element_text(size = 20))