Import packages
Histogram of sepal length, Sepal.Length, by specie status, Species, from iris dataset
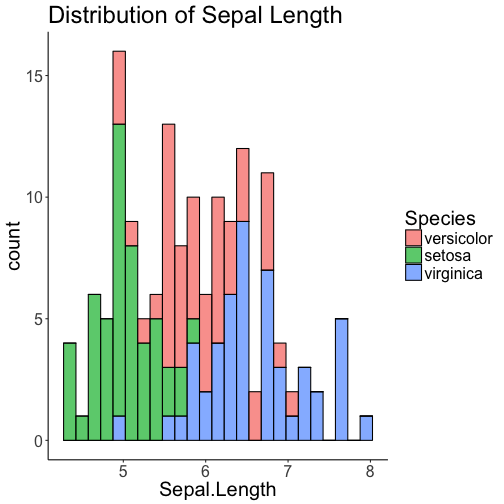
Default histogram with overlapping bars
ggplot(iris, aes(x = Sepal.Length, fill = Species)) +
  geom_histogram(bins = 25, color = "black", alpha = 0.7) + # specify alpha indicating histogram bar shading frequency
  ggtitle("Distribution of Sepal Length") + theme_classic() + theme(text = element_text(size = 20))
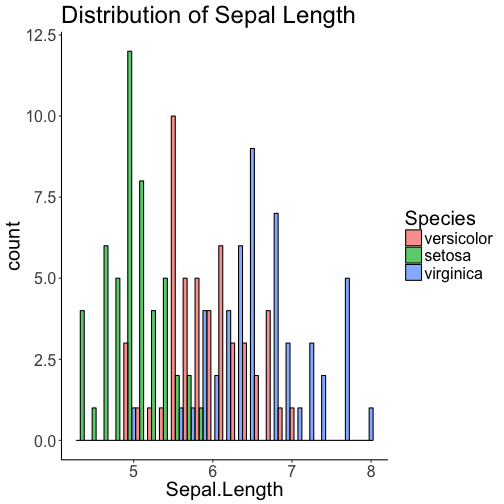
Histogram with non-overlapping bars
ggplot(iris, aes(x = Sepal.Length, fill = Species)) +
  geom_histogram(bins = 25, color = "black", alpha = 0.7, position = "dodge") +  # specify dodge position indicating non-overlapping bars
  ggtitle("Distribution of Sepal Length") + theme_classic() + theme(text = element_text(size = 20))